SP & PT versions under construction

Wind Additions
Wind power additions at a glance
Updates on global wind power at the end of 2025 [GWEC, 2026]:
-
The world added 165 GW in 2025.
-
Global cumulative wind power capacity reached 1,299 GW by the end of 2025; total offshore wind capacity amounting to 92.5 GW.
-
China maintained its absolute dominance: it added 120.5 GW, 73% of global capacity, and reaching 640.5 GW of cumulative capacity, equivalent to 49.3% of the global total.
-
Europe added 19.1 GW (up from 16.6 GW in 2024), bringing total installed wind capacity above 300 GW.
-
U.S. ranked 3rd in wind additions (6.9 GW), with cumulative inst. capacity of 161.2 GW.
-
India ranked 4th, adding 6.3 GW and reaching 54.5 GW of cumulative capacity.
- Germany ranked 5th, adding 5.7 GW, reaching 77.7 GW of cumulative capacity.
-
Brazil added 2.3 GW, reaching 36 GW of cumulative capacity, despite significant headwinds from severe generation curtailment.
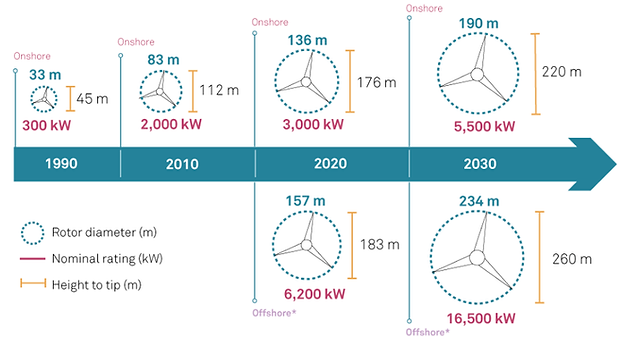
Figure 1 shows historic development of total wind systems installations through 2024. Figure 2 shows the volution of installed wind power capacity in Brazil. Figure 3 shows the evolution of installed wind turbine sizes.
Driven by a massive domestic boom, Chinese manufacturers now occupy eight of the top ten spots in the global wind turbine installation rankings. Top wind turbine manufacturers in 2025 (new installed capacity) [BNEF, 2026]:
-
Goldwind (China): 29.3 GW
-
Envision Energy (China): secured the 2nd global position
-
Windey Energy (China): among the top global leaders
-
MingYang Smart Energy (China): strong presence in both onshore and offshore
-
Vestas (Denmark): maintained the widest geographic footprint globally, though shifting positions as Asian manufacturers scaled up
-
Siemens Gamesa / Siemens Energy (Spain/Germany): Led the global offshore wind turbine supplier
-
Nordex Group (Germany): part of top global suppliers
-
Enercon (Germany): among established global OEMs
-
SANY (China): top-10 global installer
-
GE Vernova (U.S.): continued presence in global onshore markets
Figure 1: Historical wind power installations through 2024

Figure 2: Evolution of installed wind power capacity in Brazil

Figure 3: Evolution of installed wind turbine sizes