


SP & PT versions under construction
DAC & CCUS
Carbon capture

While reducing GHG emissions is imperative, it is becoming clear that reductions alone are unlikely to be enough: it will also be necessary to remove GHG from the atmosphere (known as carbon dioxide removal - CDR) to limit the global temperature increase to 1.5 °C [MKC, 2022].
Carbon capture (CC) technologies prevent the release of CO2 (carbon dioxide) to the atmosphere. In the most commonly used arrangement today, a system that can “grab” CO2 is placed in or near the stream of CO2 [CRS, 2020].
Carbon capture (CC)
CO2 can be captured from gases emitted by industrial processes (a.k.a. point-source CC) or directly from the air thru direct air capture (DAC): CO2 is about 0.04% of the atmosphere. In many DAC approaches, air is forced over a chemical that can “grab” CO2.
CO2 can then be permanently stored underground (CCS) or used as a feedstock to an industrial process (carbon capture, utilization, and storage - CCUS). Both DAC & CCUS are in early stages of development, with a few examples of operating projects worldwide. Of the two, CCUS is more mature. After capture, the process for DAC is similar to that used for CCUS and can use the same equipment for compression, transfer, and storage. Anyway, CCS is expensive, site-specific, and need custom engineering virtually everywhere it’s been tried [BNEF, 2023]. Figure 1 shows the production process of a typical CCS plant.
In the last three decades, governments and corporations have poured over USD 83 billion into CCS projects. In 2022, the technology captured just 0.1% of global emissions [BNEF, 2023]. Today, more than 70% of global CCUS large-scale projects in the pipeline are in the early stage of development; only 3% are currently under construction [SPG, 2023]. Moreover, nearly half of CC are concentrated in the U.S.: there, IRA offers incentives in the form of tax credits of up to USD 85 per ton of CO2 captured.
BECCS & CDR
In addition, BioEnergy w/ CCS (BECCS) can result in a carbon negative system. It involves capturing and permanently storing CO2 from processes where biomass is converted into fuels or directly burned to generate energy [IEA, 2023]. Ethanol plants in U.S. and U.K. are already investing in the solution (where CO2 is captured in the fermentation process) [EPBR, 2023]. In addition, upgrading biogas to biomethane is primarily based on CO2 removal and can be used for BECCS (mainly in Europe).
CDR, in turn, is needed because emissions reductions alone will not be sufficient to achieve the world’s climate goals. Consensus among top climate-focused groups (IPCC & IEA), the world will need billions of tons of CDR annually by 2050 [RMI, 2023]. CDR solutions comprise of both nature-based removals (NBR) and technology-based removals (TBR), the first removing carbon by restoring, enhancing, or actively managing ecosystems. TBR, which includes BECCS & DAC, offers a less cost-effective path to increasing CDR capacity, but generally delivers more “durable” removals by storing CO2 permanently w/ minimal risk of rerelease into the atmosphere [MKC, 2023].
CO2 production & use
Post-combustion carbon capture is the most common type of technology commercially applied in industry for CO2 removal from power generation & heavy industries [SNZR, 2022]. CO2 sourced from industrial processes produce high-purity CO2 as a by-product, such as ammonia production & biomass fermentation. Co2 can also be extracted from natural underground CO2 deposits, when it is mainly used for enhanced oil recovery (EOR) purposes [IEA, 2019].
Globally, some 230 Mt of carbon dioxide (CO2) are used every year (demand in 2015). The largest consumer of CO2 is the fertilizer industry, where over half is used in urea manufacturing, followed by the oil sector (for EOR), with just over a third of CO2 consumption.
CO2 is also used as a refrigerant in chilling systems, in fire extinguishers (eliminating flames by smothering), for inflating life rafts and life jackets, foaming rubber & plastics, in greenhouses to promote the growth of plants, immobilizing animals before slaughter, and, the most obvious industry application, in carbonated beverages.
Moreover, some CO2 applications, such as fuels & chemicals, could grow to scales of multiple billions of tons of CO2 use per year [IEA, 2019]. It is important to say, however, that CO2 use does not necessarily reduce emissions, as quantifying climate benefits is a complex task, requiring a comprehensive life-cycle assessment & understanding of market dynamics.
DAC techs
DAC plants currently operate at a small scale, but with plans to grow. Currently 18 DAC facilities are operating in Canada, Europe, and the United States. All but two of these facilities sell their CO2 for use, and the largest such plant (commissioned in Iceland in Sep/2021) is capturing 4,000 tCO2/year for storage. The world’s first large-scale DAC plant with 1 MtCO2/year capacity in the U.S. will not be operational until the mid-2020s [IEA, 2022].
DAC costs are dependent on i) the capture technology, ii) energy costs (price of heat & electricity), and iii) the plant configuration. Two technological approaches are currently being used to capture CO2 from the air: Solid DAC (S-DAC) is based on solid adsorbents operating at ambient to low pressure (i.e., under a vacuum) and medium temperature (80-120°C); Liquid DAC (L-DAC) relies on an aqueous basic solution (such as KOH), which releases the captured CO2 thru a series of units operating at high temperature (300-900 °C). Figure 2 compares S-DAC & L-DAC.
DAC's costs are projected to fall
Future capture cost estimates for DAC are wide-ranging and uncertain, reflecting the early stage of technology development, but are estimated at btw USD 125 and USD 335/tCO2 for a large-scale plant built today.
DAC deployment for carbon removal, which is an energy intensive process (and therefore expensive than capturing it from a point source), relies on the availability of low-carbon energy sources and CO2 storage. With deployment and innovation, capture costs could fall to under USD 100/tCO2. In locations with high renewable energy potential, like the Middle East, and using best available techs for electricity and heat generation, DAC costs could fall below USD 100/tCO2 by 2030.
Figure 3 shows a CCSU system, reducing CO2 emissions from the refinery sector in India. Figure 4 shows market revenues by value chain segment and share of supplier revenues by CDR tech solution type.
Figure 1: Production process of a typical CCS plant

Figure 2: S-DAC vs L-DAC
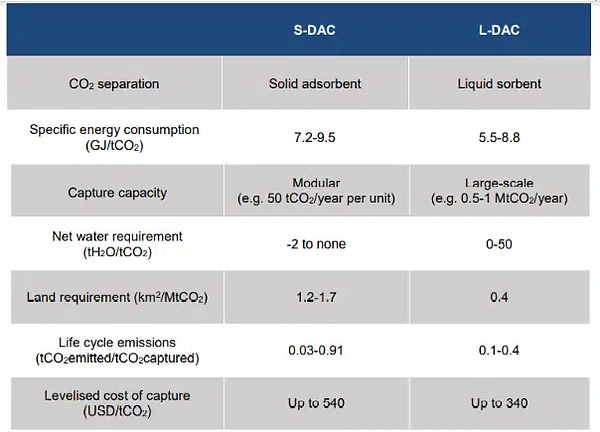
Figure 3: CCSU at the refinery sector in India
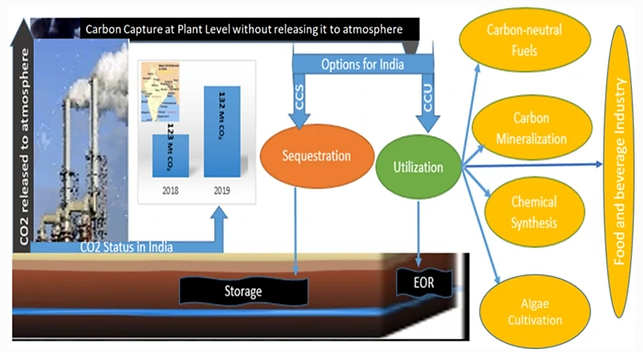
Figure 4: Market revenues by value chain segment (left) & share of supplier revenues by CDR solution type (right)
